If you run the BI stack, you probably live in two worlds at once.
In one world, you design clean schemas, tune warehouse performance, track cloud spend, and define the metrics that shape the business.
In the other, you answer Slack messages that begin with “Quick question.” You double check numbers before executive meetings. You reconcile dashboards that should match but sometimes do not.
You know the data is there. The challenge is how it moves.
PostgreSQL holds transactional truth. Redshift powers deeper analysis. AWS Billing tracks infrastructure costs. Google Analytics reflects real time web performance.Google Sheets carries the summary leadership reviews on Monday mornings.
Each system makes sense on its own. But as the person responsible for the stack, you see the seams. You see how often someone exports data to run a comparison. You see how long it takes to trace a number back to its source. You see how small inconsistencies erode confidence.
Most weeks, the job is not analysis. It is coordination.
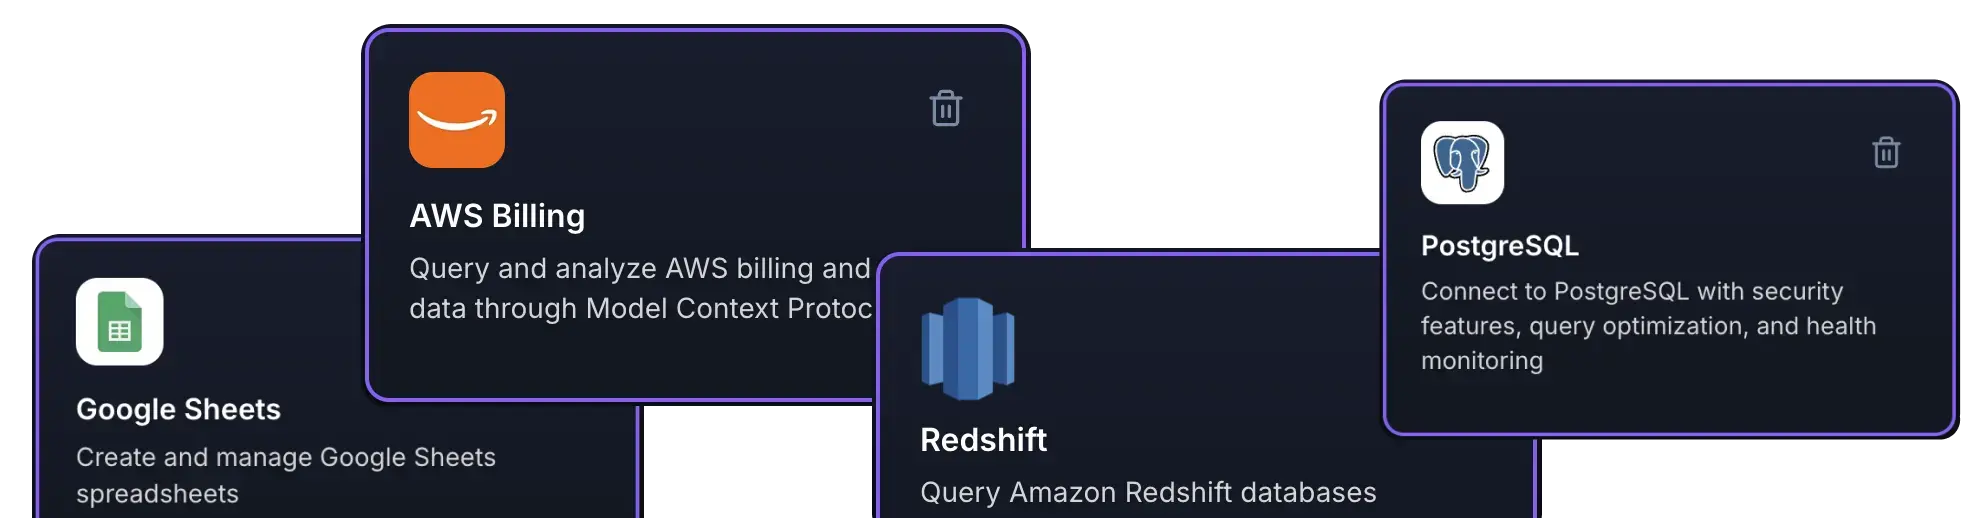
Civic Nexus supports you by connecting the systems you already manage into a single operating layer. Instead of stitching together exports and scripts, you can query across PostgreSQL, AWS Billing, Google Sheets, Google Analytics, and Redshift from one place. You reduce manual reporting and keep context intact as questions move across teams.
Here is how that shift plays out from your seat.
PostgreSQL
You maintain the core data model. When leadership asks for trend analysis, the request often turns into a manual query, a CSV export, and a separate summary.
With Civic Nexus connected to PostgreSQL, you can move more fluidly. Try these:
Try these with PostgreSQL:
“Pull last month’s key metrics and summarize the changes compared to the month before.”
“Identify the top 10 customers by lifetime value and show their purchase frequency trend.”
“Find any data quality issues in our core reporting tables.”
Instead of jumping between query editor, spreadsheet, and presentation, you generate structured answers directly from the source system you trust.
AWS Billing
Cloud costs rarely become a priority until they rise faster than expected. By the time finance flags the issue, you are already explaining what changed.
With AWS Billing connected inside Civic Nexus, monitoring becomes part of your regular cadence. Try this with AWS Billing:
Compare AWS spend this week versus last week and flag the services with the biggest increases.
Now you spot cost drift early and respond with context rather than defensiveness.
Google Sheets
Even in sophisticated data environments, the final report often lives in a spreadsheet. Updating it manually creates friction and introduces room for error. Try this with Google Sheets:
Update this weekly KPI sheet with the latest values from PostgreSQL and format it for executive review.
The sheet reflects the same source data you manage in the warehouse. You spend less time copying numbers and more time refining definitions.
Google Analytics
Website performance often becomes your responsibility even if you do not own marketing. When traffic shifts or conversion drops, you are the one asked to validate what happened and why. Try this with Google Analytics:
Flag any unusual drops or spikes in page views, signups, or conversion rate in the last 7 days, and suggest likely causes.
Instead of pulling multiple reports and manually correlating changes, you get a concise anomaly summary with likely drivers you can quickly investigate.
Redshift
Warehouse performance directly affects cost and credibility. Slow queries and oversized tables increase spend and create delays that others experience before you hear about them. Try this with Redshift:
Generate a daily performance report across our warehouse queries, including the slowest queries, largest tables, and key cost drivers.
You maintain visibility into operational health without building separate monitoring workflows.
Put the BI Stack to Work
From your perspective, the value is not flashy dashboards. It is continuity. It is knowing that when someone asks for a number, the answer traces back cleanly to its source. It is catching anomalies before they reach the board deck. It is reducing the quiet, repetitive work that surrounds every report.
Civic Nexus does not replace PostgreSQL, Redshift, AWS Billing, Google Analytics, or Google Sheets. It connects them so the systems you already oversee operate in coordination. Questions move across tools without breaking context. Reporting flows from source to summary without manual assembly.
As the person responsible for the BI stack, you carry more than queries and schemas. You carry trust. When numbers align and insights arrive on time, leadership moves faster and with greater confidence.
If you want your BI stack to spend less time stitching systems together and more time supporting strategic decisions, Civic Nexus can help you connect it properly.
Less manual reconciliation. More clarity in motion.